Friday, June 9, 2017

6-7-2017: Physical Pendulum Lab

Physical Pendulum Lab

Joel Cook
Nina Song
Eric Chong

Lab performed June 7, 2017

In this lab, we were attempting to predict the period of oscillation for various geometric shapes. By measuring the period in lab we can confirm the accuracy of our predictions.

Theory: We can calculate the moment of inertia of a geometric object, such as a triangle or square, by using calculus, center of mass, and the parallel axis theorem. 

To find the moment of inertia, we can integrate:

dI = dm*r^2

where dm is a small "piece" of mass, r is the radius, and dI is a small part of the moment of inertia. 

The center of mass of an object can be found by using the equation:

center of mass (in x or y direction) = mass 1*distance from origin + mass 2*distance from origin + ...                 
                                                                                           mass 1 + mass 2 +...

or by using calculus to integrate:

center of mass = integral of dm * x 
                                integral of dm

Finally, the parallel axis theorem states that the moment of inertia of an object around an axis other than the center of mass can be found by:

I (new axis) = I (center of mass) + M (mass) * h (distance from center of mass) ^2

Procedure:
The experiment involves predicting the period of oscillation for flat, isosceles triangle and a flat semicircle. The equations above were used to predict the period of oscillation from a small displacement of each object. The values predicted were then compared to values obtained experimentally.

Isosceles triangle: 

A ruler was used to measure the base and height dimension of a cardboard triangle. Two paper clips were attached to the top of the triangle to provide an axis of rotation. A rod was clamped to a ring stand and a flattened paper clip was taped to the rod, as shown below:


A photo-gate was setup below the triangle and a strip of paper was attached to the triangle. The strip of paper crosses the beam of the photo-gate allowing for measurement of the period of oscillation. A preconfigured file for measuring period of a pendulum was selected in Logger Pro. The triangle was displaced slightly and the period was measured and recorded in Logger Pro.

Semicircle:

The same setup as previously described was used for the semicircle, as shown below.


The semicircle was displaced in the same manner as previously described and Logger Pro was again utilized the measure and record the period of oscillation.

Data/Analysis:

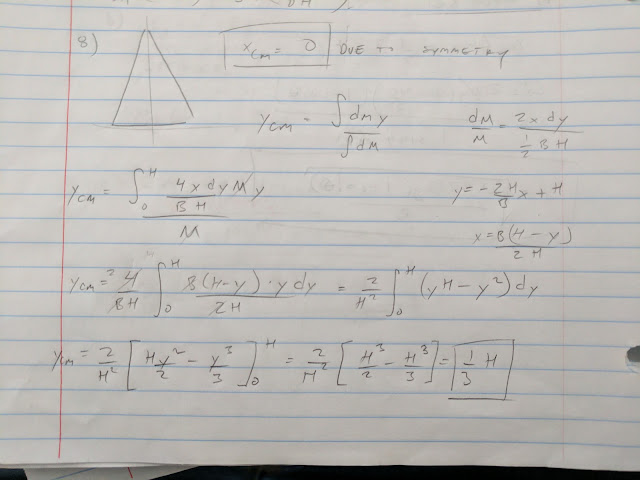
Our prediction for the period for the triangle was calculated as shown:

Center of mass of triangle:


Moment of inertia of triangle rotating about apex of triangle:

Newton's second law to obtain period:

Period of 0.674 seconds

The period of oscillation of the triangle was measured, as shown below:


The period for the triangle was approximately 0.6677 seconds. The difference between the measured value and the predicted value was approximately 0.9%.

The period for the semicircle was predicted as shown below:

Center of mass of semicircle:

Moment of inertia of semicircle rotating about center of mass:

Moment of inertia of semicircle about axis at top of arc:

Period of semicircle using Newton's Second Law:

Predicted period of 0.708 seconds.


The period for the semicircle as measured by Logger Pro:


The period was approximately 0.7107 seconds. The difference between the measured value and the predicted value was approximately 0.4%. 

Conclusion:

To address the impact of the added mass from the paper clips and tape it is important to remember that the moment of inertia of an object increases as the distance from the axis of rotation increases. For both cases in this experiment, the mass of the clips was adjacent to the axis of rotation so the impact from these is negligible for our purposes. The masking tape and strip of paper at the bottom of the objects would have a greater impact on the moment of inertia than the paper clips but the mass of the tape and paper is much smaller than the mass of the cardboard so the impact is quite small. Other factors may have impacted the experiment, including the shape not oscillating only in the horizontal plane, the low accuracy of a ruler for measuring lengths, and the precision of attaching the paper clips exactly at the top of each object. These factors would have some affect on the experiment but not enough to appreciably impact the results. In conclusion, the experiment was successful as the difference between the calculated and measured period of oscillation for both objects was within 1% of each other. 


Wednesday, June 7, 2017

6-7-2017: Lab 19: Conservation of Energy and Momentum - Angular

Lab 19: Conservation of Energy/Conservation of Angular Momentum

Joel Cook
Nina Song
Eric Chong

Lab finished May 31, 2017


In this lab, we are attempting to predict the height to which an object will rise after a collision and compare this value to the height obtained experimentally. 

Theory: 
For our system, a meter stick is attached to a pivot point and a piece of clay is placed on the floor in the path of the meter stick. The meter stick collides with the clay and the two rotate to some height together. We can predict the height by knowing that the energy will be conserved:

Kinetic energy of clay and meter stick together immediately after collision = Gravitational potential energy of the clay and stick at the highest point

1/2*I*ω^2 = m(stick)*g*Δh(center of mass of stick)+m(clay)*g*Δh(center of mass of clay)

To calculate the angular velocity of the system, we must recognize that the angular momentum for the collision will be conserved:

Angular momentum before = Angular momentum after

I*ω(initial) = I*ω(final)

Finally, to find the initial angular velocity, we will use the conservation of energy from when the meter stick is released to the moment it collides with the clay:

Gravitational potential energy = Kinetic energy immediately before collision

m(stick)*g*Δh(center of mass) = 1/2*I*ω^2

Therefore, by starting from the moment when the meter stick is released, we can finish with predicting the height of the center of mass of the clay after the collision.

Procedure:

The apparatus pictured below was used to allow the meter stick to rotate freely. The apparatus consists of a rod clamped to the the table, a pivot point clamped to the rod and a meter stick attached to the pivot at 10 cm from the end of the meter stick. 


Pins were taped to the bottom of the meter stick to ensure the clay will stick after the collision and the clay was stood up on pins to facilitate the collision and adhesion. The clay was positioned such that the meter stick will strike the clay at the bottom of its swing and the two will travel together to some final height before rotating back.


Slow motion video capture was used to record the collision. The video was analyzed in Logger Pro to find the final height of the clay and meter stick, as shown below. By advancing the video one frame at a  time, we were able to click on the highest point to which the clay travelled. The meter stick in the video was used to properly scale the video and the origin was placed at the point where the stick and clay collide.


Data/Analysis:

As the above photo shows, the clay rose to a height of 0.3245 meters. The following photo shows the calculations to determine the angular velocity of the stick just before the moment of collision. The moment of inertia of the meter stick, using the parallel axis theorem is:

I = 1/12*M*L^2 + M(4L/10)^2


The angular velocity of the stick was 5.68 radians/second.

Next, the angular velocity was used to calculate the angular velocity of the stick and clay after the collision. The moment of inertia of the clay:

I = ML^2


The angular velocity of the clay and stick after the collision was calculated as shown as 2.886 radians/second.

To find the height to which the clay travelled, we calculated the change in height of the center of mass of the clay:


The final height of the clay was calculated as 0.3138 meters. 

Compared to the height from the video analysis of 0.3245 meters yields a difference of 3.3%. 

Conclusion: 

The experiment was successful. Our prediction for height was only 3.3% different from the height obtained experimentally from one trial. There are sources of error worth noting, as well. Although slow motion video was used to capture the collision and subsequent motion, it is difficult to perfectly select the center of mass of the clay in the video. Our prediction and experimental value were approximately 1 cm different which could easily have occurred in video analysis. We used a very accurate scale to reduce the error in measuring the masses used in the experiment. Finally, the bottom of the meter stick and the clay were not touching the ground and there was friction not accounted for.


Saturday, June 3, 2017

22-May-2017: Lab 18: Moment of Inertia and Frictional Torque

Lab 18: Moment of Inertia and Frictional Torque

Joel Cook
Nina Song
Eric Chong

Lab finished May 22, 2017

In this lab, we are attempting to calculate the moment of inertia and angular acceleration for a rotational apparatus. With the moment of inertia and angular acceleration, we can predict the time it will take a cart, tied to the apparatus, to descend down a ramp.

Theory: By measuring the mass and dimensions of an object, we can use this data to calculate the moment of inertia of a disk with the following equation:

I (moment of inertia) = 1/2 * m (mass) * r^2 (radius)

Our apparatus is a series of disks (cylinders) and the total moment of inertia of an object is the sum of the moments of inertia of each part of the object. 

To predict the time the cart will take to descend a ramp of known angle and length, we measured the angular deceleration of apparatus and used kinematics to calculate the time it should take:

Angular acceleration = tangential acceleration
                                                  radius

Tangential acceleration = acceleration of the string = acceleration of the cart

Displacement = initial velocity * time + 1/2 * tangential acceleration * time^2

Procedure: 

The rotational apparatus for the lab is pictured below:


We used calipers to measure the dimensions of the rotating portion of the apparatus. The dimensions are shown below:
The mass of the rotating portion is stamped on the disc. The dimensions of the object were used to calculate the volume of each portion of the apparatus. Assuming a uniform density, the volume of each portion can be used as a percentage of the total volume to calculate the mass of each part. The mass of each part, and dimensions, were used to calculate the moment of inertia of each component.

For the next portion, we used slow motion video capture and logger pro on the computer to record video of the disc as it rotated and slowed. The video was then analyzed to determine the tangential speed of the disc as it slowed. The edge of the tape on the disc was used as a reference point to click in each frame of the video, as shown below.


The video analysis yielded the graph below for X and Y axis position vs time for the rotation.


To calculate angular acceleration (α), the tangential velocity was calculated and graphed by knowing that tangential velocity is:

Vtan = (Vx^2 + Vy^2)^(1/2)


The tangential velocity was used to calculate ω through the following relationship:

Vtan = ω* r (radius)

By graphing angular speed vs time, we can calculate the angular acceleration of the disc by finding the slope of the line through the data points graphed, as shown below:


Once angular acceleration was determined, and the relationship between angular acceleration and tangential acceleration identified (α = a/r), the acceleration of the cart was known and the time for the cart to travel one meter down the track shown below could be calculated.


The string was wrapped around the smaller axis of the apparatus and timed as it descended down the ramp. This value was compared to the value obtained through calculation. 

Data/Analysis:

As described previously, the volume of the rotating portion of the apparatus was calculated from the dimensions of the apparatus.

The volume for each small cylinder was calculated:

V (cylinder) = pi * radius^2 * height

V = pi *(30.8/2)^2 * 52.3 = 38966.64 mm^3

The volume of the disc was calculated:

V = pi*r^2*h = pi * (200.46/2)^2 * 14.6 = 460784.8 mm^3

Adding together the disk and the two cylinders gives a total volume of 538718.13 mm^3. The percentage of volume that each part contributes was calculated:

Volume of part/total volume * 100 = % Volume of apparatus

Each cylinder was approximately 7.23% and the disk was approximately 85.45% of the total volume. Therefore, multiplying the total mass of the object by the percentage each part contributes, the mass of each part can be determined:

Total mass * % volume = mass of each part

The mass of each cylinder was approximately 333.665 g and the mass of the disk was 3947.67 g.

With the dimensions of each part and the mass of each part, we can calculate the moment of inertia:

I (moment of inertia = 1/2*Mass*radius^2

I (total) = I (disk)+I (cylinder 1) + I (cylinder 2)

I (total) = 1/2*(0.333665 kg)*(0.0154 m)^2 + 1/2*(0.333665 kg)*(0.0154 m)^2 + 1/2*(3.94767 kg)(0.100023 m)^2

I (apparatus)= 0.0199 kgm^2

The video analysis described in the procedure yielded an angular acceleration of -0.1903 rad/s^2. This is the force of friction on the disc as it rotates.

Scene 2, The Cart:

As shown in the following calculations, the moment of inertia was used to calculate the acceleration of the cart.

The first photo shows the free body diagram for the system:


By using Newton's second law, force equals the product of mass and acceleration and therefore torque equals the product of moment of inertia and angular acceleration, we can calculate the acceleration of the cart. The angular acceleration from friction was accounted for to more accurately predict the acceleration.


This acceleration for the cart was then used to predict the time it should take for the cart to descend the track. The prediction used a 40 degree angle for the track so the actual trials were setup with a 40 degree angle as well.

Δ x = Vo*t + 1/2*a*t^2   (Vo = 0)

t = (2*Δx/a)^(1/2)

t = (2*1/0.0402)^(1/2) = 7.05 seconds

Three trials were timed for the cart descending the ramp. The data was as follows:

Trial 1: 7.36 s
Trial 2: 7.65 s
Trial 3: 7.63 s

Average time: 7.55 s

Difference between predicted and actual: (1- 7.05/7.55) * 100 = 6.62%

Conclusion:

Even though the actual and predicted time for the cart descending the track was more than 6% different, I would classify the lab as a success. We were able to take basic measurements and use the data to make a fairly accurate prediction. Errors and uncertainties existed at multiple points throughout the lab. The measurements for dimensions and mass, as well ass the angle of the track, have a small uncertainty that was mitigated as much as possible by using more accurate implements to measure. There is also an uncertainty in the timing of the descent of the cart that are inevitable due to the unreliable nature of human reflexes.